| |
Oxygen (O, Z=8) is a particularly important element in many different systems. In geologic systems it is the most abundant element. In metallurgical systems, oxygen's importance comes from its role in corrosion. Yet for all of its importance, it is arguably the least analyzed of the major elements. The reason for this is the difficulty in getting good results. Most quantitative analyses of oxides do not measure the oxygen abundance directly, but calculate it assuming a fixed stoichiometry for each oxide. This works in most cases, but for some oxides there is not a single fixed oxidation state. The best example of this is iron, which occurs both as Fe2+O and Fe3+2O3.
The biggest problem with analyzing for oxygen is that it produces very low-energy X-rays, and these X-rays are easily absorbed. Add to this the problem that most oxides are non-conductive; therefore they need a conductive coating deposited onto their surface be fore being analyzed with an electron beam. Typically, a carbon coating is used for quantitative analyses because carbon's low atomic number means fewer of the generated X-rays will be absorbed. However even thin carbon coatings can greatly absorb very low energy X-rays like those from oxygen. The plot below
shows the range in measured oxygen from SiO2 glasses that were coated using normal coating procedures, but at different times. It demonstrates that even when trying to be consistent with the carbon coating a significant range in carbon thicknesses may be deposited, and this impacts the oxygen analyses by as much as ±10 weight percent. The best solution is to carbon coat the standards and the unknown at
the same time to ensure identical thicknesses. |

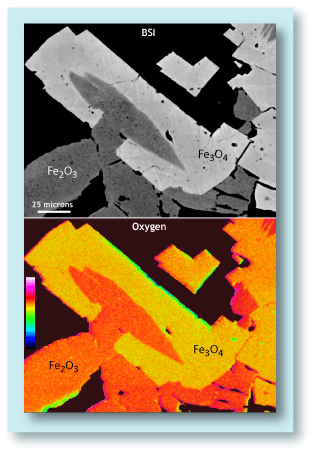
Backscattered electron image (BSI) and
oxygen element map of magnetite (
Fe3O4)
and hematite (Fe2O3) grains. The hematite
has about 2.5% more oxygen than the magnetite.
(Sample is from the Biwabik Iron Formation.)
|


