|
|
|
|
| |
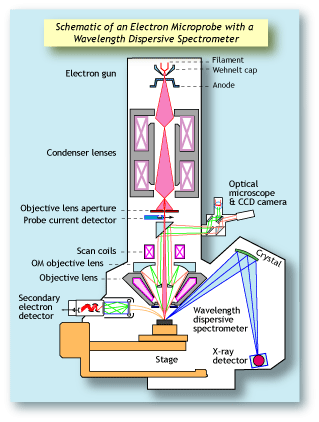
Electron microprobes (also referred to as electron
probe microanalyzers or EPMA) have been around for
many decades. They differ from scanning electron
microscopes in that they are configured with wavelength dispersive spectrometers (WDS).
Each element produces a unique set of characteristic
X-rays when bombarded with electrons. Each X-ray will
have a specific energy and wavelength. Energy dispersive spectrometers (EDS) sort the X-rays based on
their energy; while wavelength dispersive spectrometers (WDS) sort the X-rays based on their wavelengths.
WDS systems use X-ray diffraction as the means by
which they separate X-rays of different wavelengths.
The spectrometer consists of an analyzing crystal and
a detector. Those X-rays that hit the crystal and diffract will enter the detector. Whether an X-ray photon
will diffract depends on its wavelength, the orientation
of the crystal, and the crystal's lattice spacing. Only
X-rays of a given wavelength will enter the detector
at any one time. To measure X-rays of another wavelength, the crystal and detector are moved to a new
position. Since a specific WD spectrometer can
measure only one X-ray wavelength at a time, it is
important that a WDS system has an array of spectrometers in order to work efficiently. Electron microprobes typically have up to five WD spectrometers,
allowing them to measure five elements simultaneously. Each spectrometer typically has between two
and four analyzing crystals, each with a different
lattice spacing, because each type of crystal can
diffract only a given range of wavelengths. |
|
|
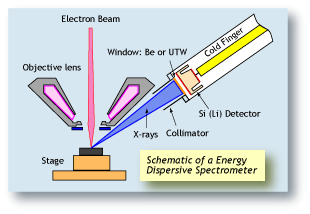 |
Energy dispersive spectrometers (EDS) work on a completely different principle than WDS. The central component of an EDS system is a solid-state detector, consisting of a semiconductor. As each X-ray photon hits
the detector, a very small current is produced by knocking
out electrons from the semi-conductor. Each electron
ejected from a silicon electron shell consumes about 3.8
eV of energy from the X-ray. Therefore an X-ray photon
starting with 7,471 eV of energy (Ni Ka) will produce a
current of about 1,966 electrons. By measuring the
amount of current produced by each X-ray photon, the
original energy of the X-ray can be calculated. An EDS
spectrum is essentially a histogram of the number of
X-rays measured at each energy. |
|
|
| |
There are advantages and disadvantages to both EDS and
WDS systems. One of the main advantages of the EDS
system is that the user can quickly collect a full spectrum
with the push of a button. Using a WDS system the user
must use multiple spectrometers to get the entire periodic
table, and has to mechanically scan the spectrometers from
one limit to the other.
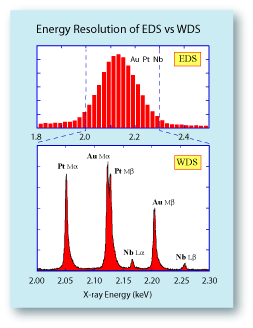
However, the most significant difference between WDS and
EDS systems is their energy resolution. A Mn Ka X-ray line on
an EDS system will typically be between 135-150 eV wide.
On a WDS system, this same X-ray line will only be about
10 eV wide. This means that the amount of overlap between
peaks of similar energies is much smaller on the WDS system.
To the right is a comparison of spectra collected from a Pt-Au-Nb alloy on a WDS compared to an EDS system. On the
WDS system six X-ray lines can be identified, with an overlap
occurring only between the Au Ma and the Pt Mb lines. It
would be very straightforward to identify the elements
present and to quantify their abundance without resorting
to an elaborate deconvolution procedure. On the EDS system,
the broad nature of the X-ray lines mask each other and
they appear to be a single peak. It would be impossible to
reliably deconvolute this peak into the individual X-ray lines. |
|
|
 |
The second major problem with EDS systems is their low
count rates and poor reproducibility. Typically a WDS system
will have a count rate about 10x that of an EDS system. There
are some EDS systems that can collect at a higher count rate,
but they sacrifice even more on the energy resolution —
their peaks are even wider.
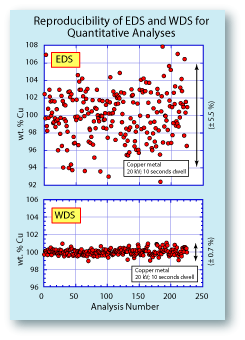
To the left is a comparison of the reproducibility of an EDS
system and a WDS system. The data were collected simultaniously, so the conditions under which they were collected
were identical. The plots show that the EDS data had almost
8x the scatter of the WDS data. For serious quantitative
analyses, the EDS data would not be acceptable. The spread
on the EDS data could be reduced by counting longer, but
that would also improve the WDS data. Another advantage of the WDS system includes a lower
detection limit. Most elements on the periodic table can be
measured into the 0.01 weight percent range on a WDS system
and into 0.1 weight percent range on the EDS system. Also,
much better performance can be obtained for light element
analyses (Be, B, C, N, O and F) on a WDS system. The count rates
will be much better, peak overlap problems will be fewer, and
reproducibility will be much improved compared to EDS. |
|
|
|
|
| |
| |