|
|
|
|
| Boron (Z=5) is one of the more difficult elements to
analyze. It has a very low count rate and it experiences
peak shifts and shape changes from one materials or
standard to another. The low energy nature of the boron
X-ray makes it easily absorbed by the sample and the
detector. This produces the low count rate, and because
the production of the boron X-ray involves a valance
electron, its peak can shift considerably with any change
in the nature of the atomic bonding. Therefore there can
be peak shifts or shape changes between the standards
and the material being analyzed.
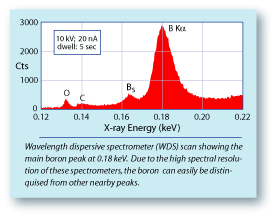
If the goal is to produce quality elemental X-ray maps
and precise quantitative analyses, it is important to use
wavelength dispersive spectrometers (WDS). WDS
systems can produce X-ray count rates that are at least
10x higher than those from most energy dispersive
spectrometers (EDS), and have an energy resolution that
is 10x smaller. |
|
|
| Therefore they can produce X-ray maps of excellent quality in a fraction of the time, and can easily resolve the boron peak from nearby neighboring peaks even when there is only a few tens of eV between them.There are a number of other problem that can be associated
with analyzing boron-rich materials. One is that boron can be
very hydroscopic. Care must be taken during sample preparation to avoid contact with water or even just moisture. |
|
|
|
Boron-rich samples are also very susceptible to electron beam
damage. To avoid this problem a low beam currents should be
used during the analyses.
In order to improve the production of boron X-rays, a low accelerating voltage should be used, when possible 10 kV. Higher
accelerating voltages will produce higher number of X-rays,
but they will be produced deeper in the sample. Therefore they
get absorbed by the sample before they can make there way
to the surface. This lower accelerating voltage will also reduce
the amount of beam damage during the analyses. |
|
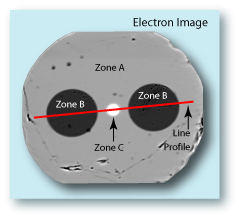
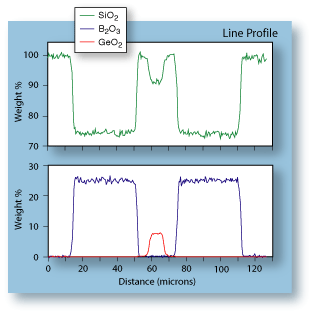
| Above is the backscattered electron image of the
optical fiber's end-face. Labeled are the three
zones of interest, the core (Zone C), the boron-rich
zones (Zone B), and the matrix glass (Zone A). The
superimposed red line is the location of the line
profile. The results of the line analyses are shown
to the right. Line profiles have the advantage of
showing the element distribution in the sample,
but at a fraction of the time that it takes to collect
a map. However line profiles are typically semi-quantitative in nature, because they tend not to
be matrix corrected.
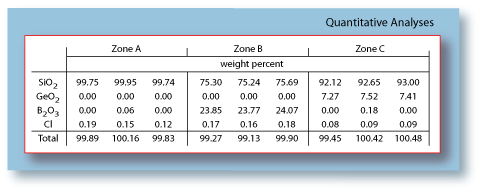
For true quantitative analyses, it is essential that
good standards be used, and that the appropriate
corrections are made for the matrix effects.
Standardless analyses should never to be relied
upon. It is also important that the results from the
quantitative analyses should not be normalized.
Normalization typically hides errors that are
contained within the data. |
|
|
|
|
|
| |

