| McSwiggen & Associates |
| /Tech Notes/Beryllium |

| Beryllium (Be, Z=4) is the lightest element that
can presently be analyzed on an electron microprobe. In the future, it may be possible to
measure lithium (Z=3). Presently, however, the
detector's windows absorb too many of the
ultra low-energy lithium X-rays for it to be practical.
Hydrogen (Z=1) and helium (Z=2) will never be
measured using an electron microprobe because
each has only one electron shell and therefore
they do not produce characteristic X-rays when bombarded with
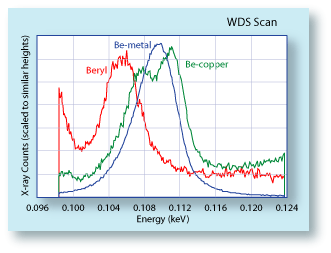
electrons. One of the biggest problems associated with doing any kind of beryllium analyses is that the beryllium X-ray line can undergo an enormous amount of energy shifting or shape changing. The plot to the right shows the measured Be Ka line from three materials, pure Be metal, Be-copper (with 1.75 wt.% Be), and beryl (Be3Al2Si6O18 ~13 wt.% BeO). |
 |
 |
Because of the peak shifts that can occur
with Be, great care must be taken with any
type of analyses. For map or line analyses
it is a matter of making sure that the spectrometer has been peaked for maximum
counts. However with quantitative analyses,
it is important that the peak shape is modeled.
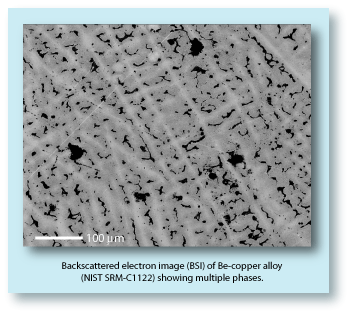
The different phases in the Be-copper alloy can be seen in the backscattered electron image to the left. The alloy has segregated into three phases. There is a light-gray phase that forms the framework of the alloy; there is a medium-gray phase which forms most of the interstitial volume, and there are inclusions of a dark phase that fills the rest of the interstitial volume. Since the intensity of the backscattered electron signal is controlled by the average atomic number of phase being imaged, the dark phase must have a lower average atomic number then the light- or medium-gray phases. Therefore the various phases of the |
|
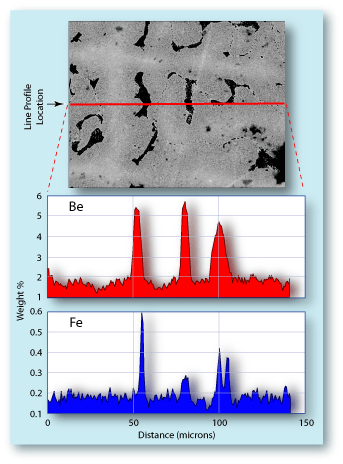
Be-copper alloy must have significant differences in their element composition. An example line profile across the various phases of the alloy is shown to the right. The profile shows a relationship between the backscattered electron intensity and the abundance of Be and Fe.
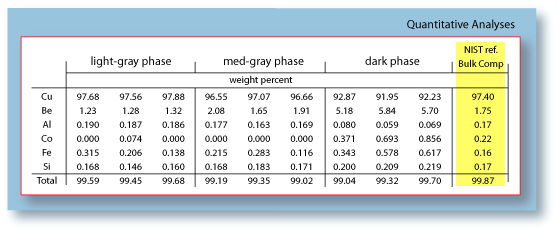
Below are quantitative electron microprobe analyses of the different phases. As expected, the dark phase is much higher in Be, which ranges from a low of 1.2 weight percent in the light-gray phase to almost 6 weight percent in the dark phase. Fe and Co also vary between the phases, but to a much smaller extent. Also, listed in the table below is the certified bulk analyses from the National Institute of Standards and Technology (NIST). When doing quantitative analyses on a beryllium-bearing phase, care must be used in selecting the matrix correction routine. The different correction routines can produce significantly varied results. These correction routines play a large role in the Be analyses because of the high absorption |
 |


